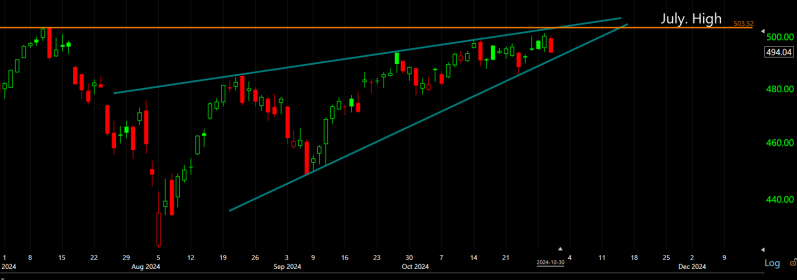
1. Converging Trendlines
The chart displays two upward-sloping trendlines that are gradually converging. The lower trendline (support) has a steeper slope, while the upper trendline (resistance) is flatter—this is a classic characteristic of a rising wedge pattern.
2. Waning Momentum
Within the wedge, price swings are becoming increasingly narrow, indicating diminishing volatility. This suggests that bullish momentum is fading as price approaches the upper resistance line.
3. Bearish Bias
A rising wedge typically carries bearish implications, particularly when it forms after a strong rally. The pattern signals that the uptrend may be losing steam, and a breakdown below the lower trendline could trigger a reversal or correction.
4. July High Resistance
The July high at 503.52 adds further significance to the pattern as a horizontal resistance level. If QQQ fails to break above this level and instead breaks below the wedge support, it would confirm the reversal signal.
Summary
This rising wedge suggests that the current uptrend may be running out of momentum. A decisive break below the lower trendline, especially accompanied by increased volume, would signal a potential trend reversal or deeper pullback.
Confirmation will depend on whether the breakdown is clear and volume-backed.
More Information/Reports/Video/Analysis please contact us—info@the-currency-store.com. We offer fully customised content services tailored to you needs.
Add comment
Comments