The core theme today: the Russell 2000 may continue to rise in the next four weeks, until mid-September.
To understand this, we need to look at market breadth.
Recent Review
In the August 7 analysis, TCS pointed out a clear bear divergence. Large-cap stocks, represented by QQQ, kept pushing higher, while small and mid-cap stocks stayed flat. Normally this signals higher risk.
One week later, the situation changed.
QQQ at 563: A Balance Point
At the start of August, TCS highlighted that 563 on QQQ was a key balance point between bulls and bears. Prices pulled back for two days, but from a time perspective, a full downward cycle had not formed.
V-shaped rebounds are common in markets. Sharp inverted V-shaped crashes are rare. That is why we expected a rounded distribution top instead.
The divergence stayed. Large-caps rose, while small and mid-caps lagged. Then a key shift appeared.
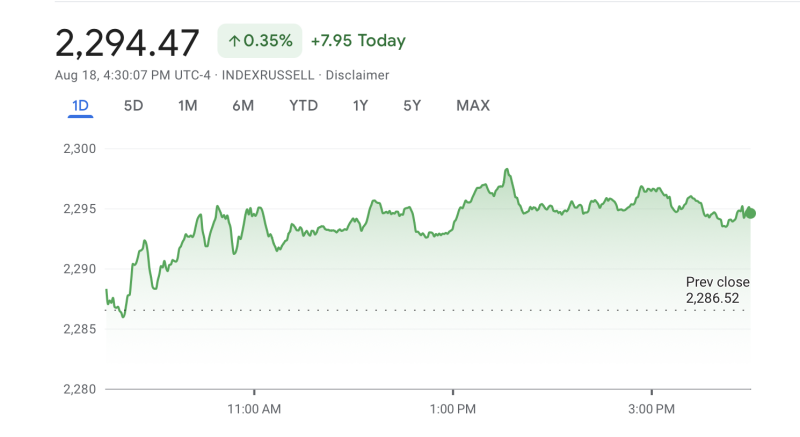
Russell’s Breakout
On August 12, the Russell formed a strong bullish candle with much higher trading volume. This suggests a new stage of upward movement.
This breakout helped “save” market breadth. It shifted the rally from being led only by large-caps to broader participation.
Data confirms the change. A month ago, only about 40% of stocks had drawdowns of less than 5%. Now the number is over 50%. Market structure is improving.
Outlook
Even with the strong divergence in QQQ, a sudden collapse is unlikely in the short term. Russell’s strength has delayed the downward cycle. The rounded top may form later, closer to mid-September.
This also links with the Jackson Hole meeting this Friday. Both QQQ and the S&P are in rectangle or flag patterns. With moving averages still in a bullish setup, the chance of more upside is higher. For the S&P, the next potential target is 6,550.
Russell’s 240 Level
The 240 level on Russell is very important:
• It was a resistance point in Nov 2021 and Nov 2024
• It created a heavy volume zone
• It works like a “magnet,” attracting prices toward it
So, 240 is both resistance and a price target area.
Stock Watch
Some stocks worth watching:
• Tesla (TSLA): Broke out and is now in a flag pattern. Short-term moving averages may soon support another push higher.
• Oracle (ORCL): If it recovers the midpoint of the last big red candle, more new highs are possible.
• Chevron (CVX): In consolidation with conditions for a breakout.
• Pinduoduo (PDD): Forming a cup-and-handle pattern. If the handle completes, the target could reach 135 USD.
• Coinbase (COIN): On the weekly chart, price is back to the value zone near 300. Holding above key support may lead to another high.
• Intel (INTC): Last week’s strong bullish candle was a reversal signal. Pullbacks may be buying opportunities.
• UnitedHealth (UNH): Similar to INTC. Both weekly and daily charts show reversal signs. Short-term moving averages may soon confirm a buy signal.
Conclusion
In mid-August, Russell acted as a “rescuer” of the market. It improved breadth and delayed the downward cycle that might have started earlier in August. This relief rally may last until mid-September. After that, a rounded top and correction may appear.
Watch the 240 level on Russell and keep tracking market breadth. Whether trading trends or swings, strict discipline remains the key.
More Information/Reports/Video/Analysis please contact us—info@the-currency-store.com. We offer fully customised content services tailored to you needs.
Add comment
Comments